


The Climate Intelligence Layer for Global Finance
Turn data into verified action, at enterprise scale.
Traditional Way vs. Myplan8® Way
In the traditional model, value flows from financial institutions to borrowers or consumers with little linkage to real-world climate outcomes.
Myplan8® changes this: the Green Navigator engine and Green Compass data layer embed climate intelligence across every transaction and decision point.
As a result, banks offer climate-financed products, businesses unlock verified green credit, and individuals participate in data-driven climate action.
Built for Global Scale. Measured with Precision.
Green People Score™
measures individual behavior and lifestyle footprint against global standards.

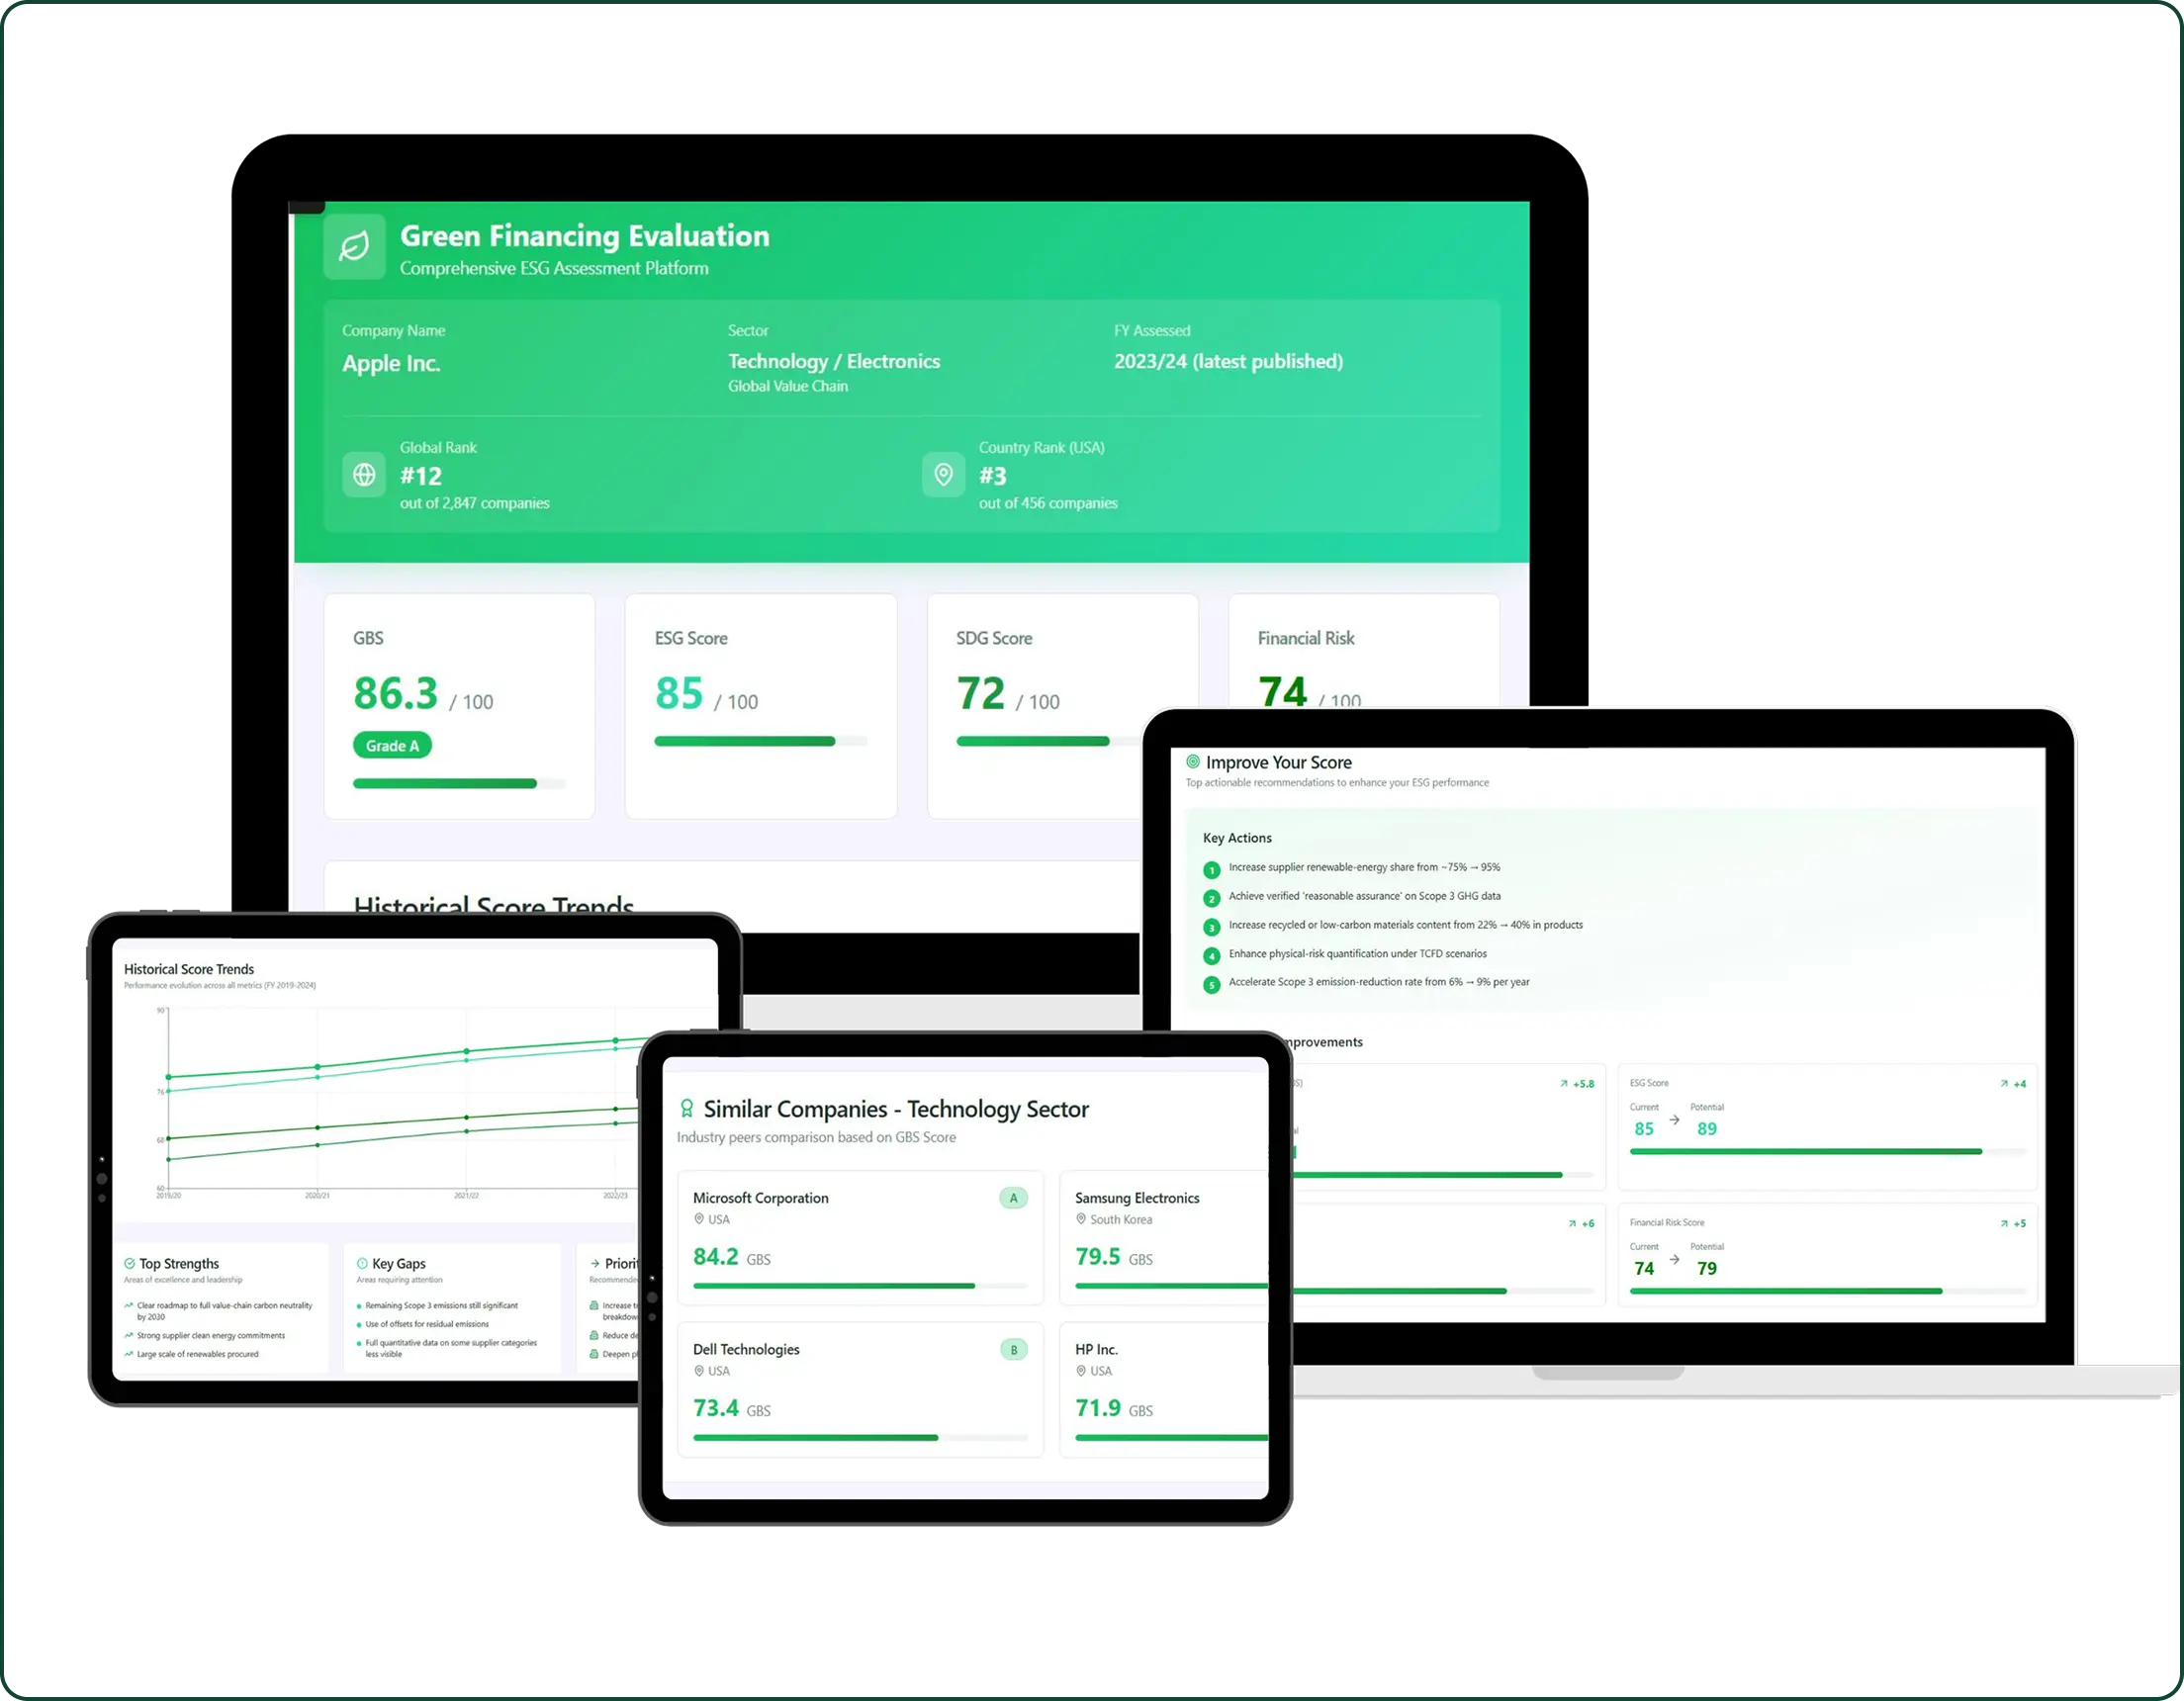
Green Business Score™
evaluates enterprise climate performance using rigorous metrics aligned with ESG and SDG frameworks.
Green Navigator™
analyses data flows, identifies improvement pathways, and guides measurable carbon-reduction action.

Green Compass™
serves as the audit-grade data layer for ESG/SDG verification, enabling transparency and global standard reporting.
Green People Score™
measures individual behavior and lifestyle footprint against global standards.
Green Business Score™
evaluates enterprise climate performance using rigorous metrics aligned with ESG and SDG frameworks.
Green Navigator™
analyses data flows, identifies improvement pathways, and guides measurable carbon-reduction action.
Green Compass™
serves as the audit-grade data layer for ESG/SDG verification, enabling transparency and global standard reporting.
Climate Intelligence Delivered Across Ecosystems
Banks & Regulators
Integrate Myplan8® APIs to trace and optimise climate-financed flows, ESG compliance and risk modelling.
Explore Banking SolutionsBusinesses
Deploy enterprise dashboards, unlock Green Business Score™, achieve Green Place to Work® certification, and monetise verified reductions.
View Business SolutionsIndividuals
Join the data-driven journey: get your Green People Score™, earn green credits, offset your footprint and engage with climate-smart rewards.
Start Your Journey
Product that Turns Intelligence into Scalable Climate Action
Carbon iQ
A suite of intelligent APIs enabling banks and financial institutions to embed carbon analytics, ESG insights, and sustainability scoring directly into their digital ecosystems. Measure transaction-level emissions, enable green finance, and automate ESG/CBAM reporting with accuracy and scale.
Ideal For: Banks, Regulators, and Fintechs
Explore Carbon iQTransform Transactions into Verified Climate Action

Myplan8® integrates at the point of transaction — payments, supply-chains, lending, mobility, consumption — converting economic activity into measurable climate outcomes.
Every transaction becomes part of the intelligence layer, tracking, verifying and reporting impact aligned with global standards.
Leading the Change — in Numbers
With global standards baked into every data model, Myplan8® enables clients to meet international frameworks and regulatory expectations — anywhere in the world.
Tn CO₂e analysed through our platform in the past 3 years
Verified Green Workplaces & businesses
Transactions converted to climate action
Green people scores issued
Awards & Accolades
UNDP Youth CO:Lab
Winner of 2022
Green Finance Cohort
Winner of 2023 by Ahmedabad University's Venture Studio
Green Innovation of the year — Green Score™
Winner of 2024 Sustainability Awards
Powered by Verified Data, Behavioral Science & Global Standards Body
Our platform incorporates audit-grade datasets, SDG/ESG taxonomy alignment, and AI-driven analytics, delivering climate insight you can trust and scale.
We have a patent published on Green Scoring System™.
The detailed capture of all expenditures provides a rich dataset, enabling a more accurate calculation of the carbon reduction strategy.


Compliance for
Explore Carbon iQFrequently Ask Question
Turn Intelligence into Action — Globally
Whether you're a bank, business or individual, Myplan8® gives you the tools to integrate climate intelligence into your ecosystem, power real-world impact and report it globally.